Power Law Lab - Venture Fund Simulator
What 10,000 simulated versions of our fund taught me about venture math — and the questions every GP should be able to answer.

Last month while putting together our quarterly LP update I realized that while I knew our fund’s TVPI, I had no real way to place it in context. Was that number the median outcome of our strategy? The top decile? A near miss?
Every GP I’ve pitched has a similar line ready when an LP asks. I’m not sure any of us actually knows.
So I built a tool to find out. It’s called the Power Law Lab, and it runs 10,000 simulated versions of a fund you describe.

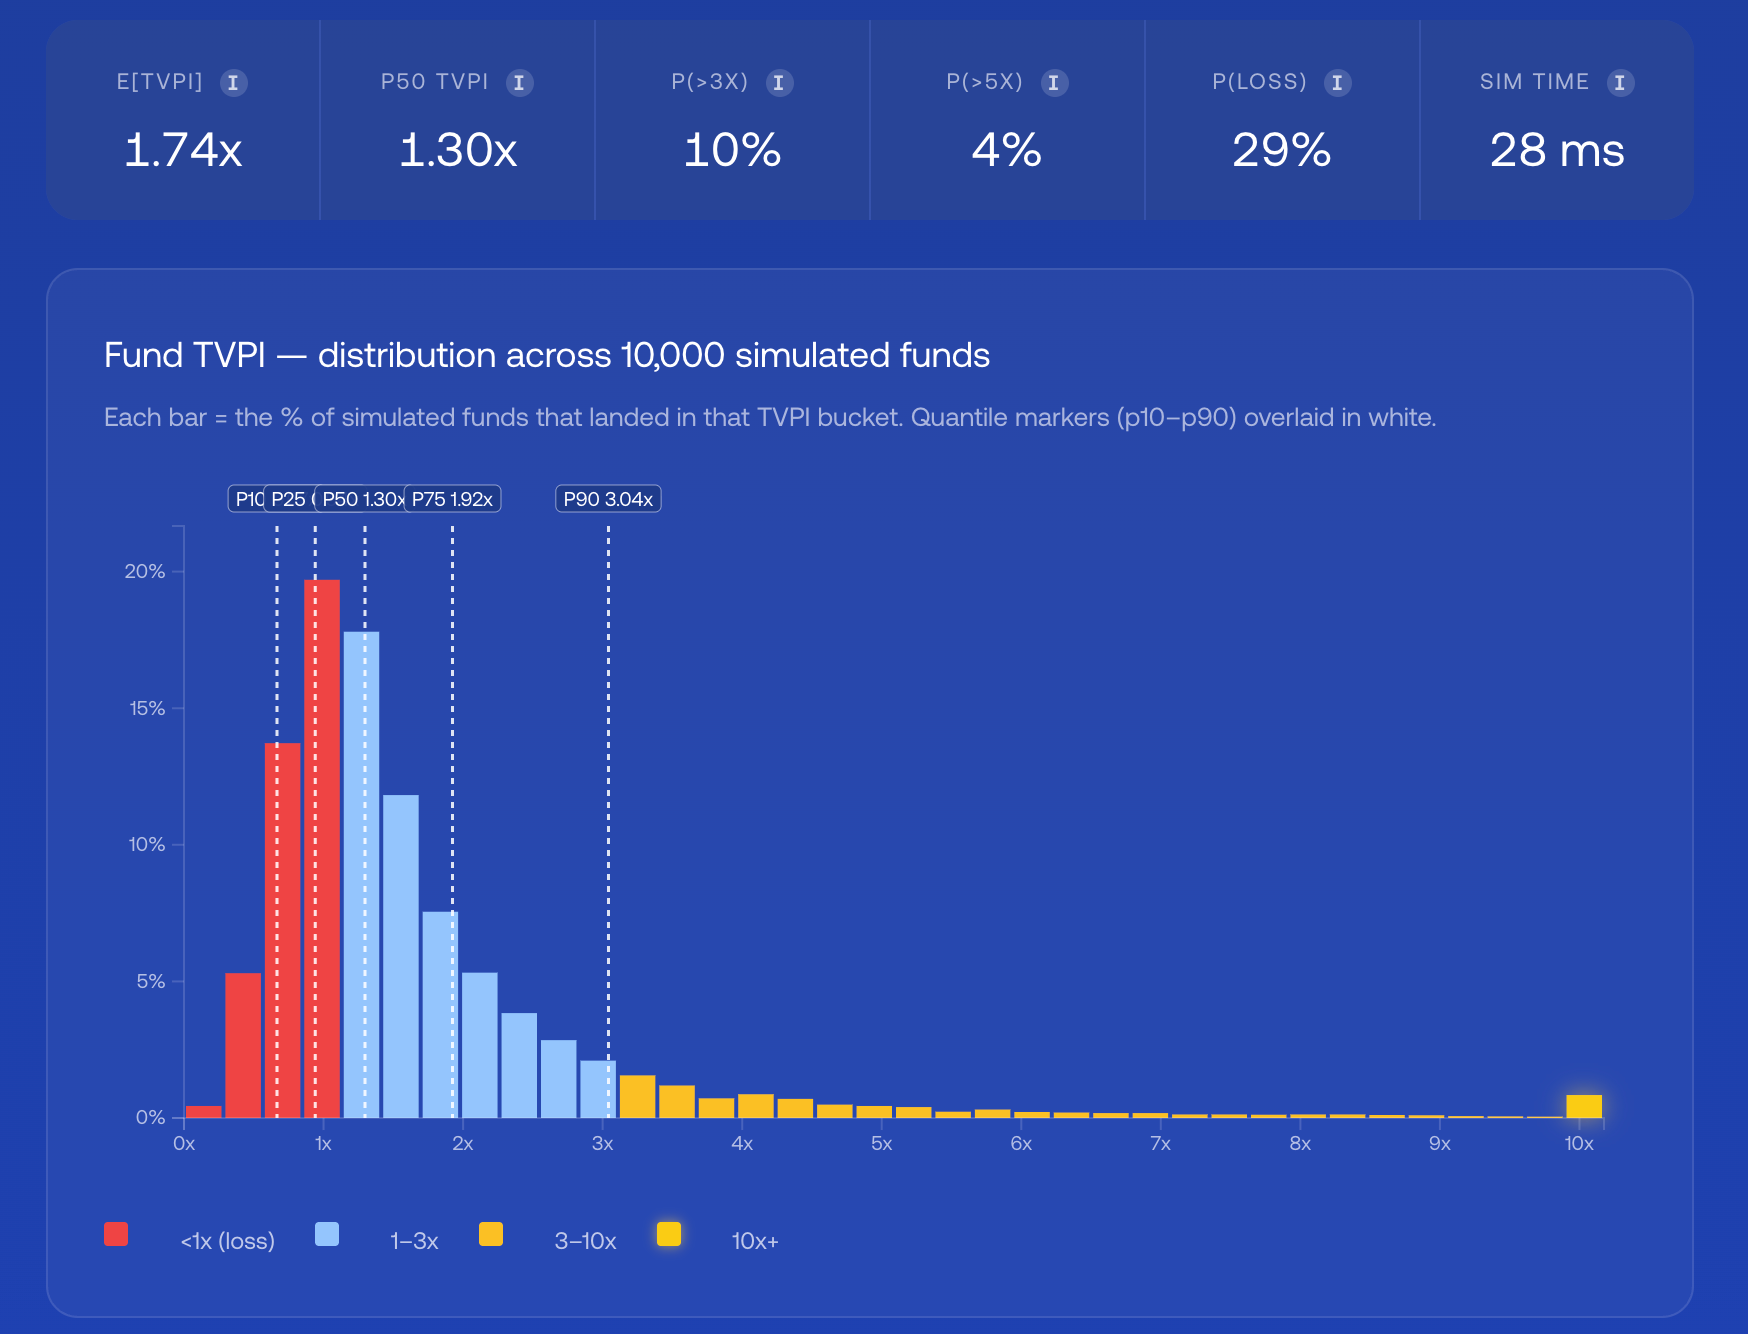
The histogram shows the full distribution of plausible outcomes and not just the headline number.
What we noticed
Venture returns are power-law shaped. A handful of investments produce nearly all the returns. Every GP knows this. Every LP nods.
But that’s usually where it stops. We don’t internalize the consequences. When I write “we’re targeting a 3x net TVPI” in a deck, what’s behind that number? Is it the mean across plausible outcomes? The median? The top quartile? I’d be lying if I said I had a precise answer.
The mean and the median are not the same thing. In a power-law distribution, the mean is dragged up by rare right-tail outliers. The median is much lower. A “2x fund” by mean might be a 1.2x fund by median, with one Uber-shaped outlier doing all the work. The deck quotes the mean because that’s the flattering number.
What this actually does
Describe a fund its size, the number of investments, the failure rate, the shape of the right tail, your reserves strategy, your ownership target. The lab runs 10,000 simulated versions of that fund and renders the distribution.
The math is a mixture model: each company either returns zero (with some loss probability) or draws an outcome multiple from a truncated Pareto distribution. The shape parameter α controls how fat the tail is, and α turns out to be the most consequential slider in the lab.
Calibration follows public empirical work from Correlation Ventures, Kauffman, Carta and AngelList. The Seed preset assumes a 50% loss rate, α=1.2, cap at 500x. Series A and Growth presets get progressively thinner tails.
I vibe-coded the first version over a weekend. ~800 lines of JavaScript. Runs in your browser. No server.
3 things the lab taught me about our fund
1. More investments doesn’t help you.
Expected fund TVPI is invariant to the number of investments if you hold the strategy constant. Going from N=15 to N=50 doesn’t move the mean. It collapses the variance. That feels safer, but LPs aren’t paying us for the median. They are paying for exposure to the right tail. Indexing the power law squeezes that out of your own portfolio.
2. Follow-on discipline moves more than anything else.
Switching from pro-rata across the portfolio to super pro-rata into winners moves median TVPI more than any other parameter I tested. More than fund size, check ownership, or tail thickness. Reserves aren’t a hedge. They’re a second swing at the same pitch. We had been pro-rata-ing out of optionality and reputation. The math doesn’t support that choice as strongly as I’d assumed.
3. The median fund is boring.
Even with realistic seed-stage parameters, the median simulated fund returns roughly 1.3x net. The point isn’t that venture math is hopeless. It’s that the median is the natural outcome, and the funds distribution is itself power-law shaped. You can’t average your way into the tail.
What this actually means
Most GPs cannot tell you where their current TVPI sits in the distribution of plausible outcomes for their strategy. I couldn’t, before I built this. The pitch deck quotes the mean because that’s the number that flatters us most.
For LPs, the lab gives you a way to plug in a manager’s stated strategy and stress-test their projections. If their 3x target sits in the top decile of plausible outcomes for their setup, you should know that before the IC meeting.
For GPs, it’s an honest conversation with yourself. Where are you in the distribution? What would have to be true for the next-quarter mark to move you up?
Try it
3 calibrated presets, 6 scripted scenarios. Each scenario isolates a single counter-intuitive thing the math does that pitch decks gloss over. Start with the N debate scenario.
Every parameter gets encoded in the URL hash, so you can send a colleague the exact configuration you’re looking at.
If you find something useful or something you disagree with I’d love to hear it. The model has deliberate simplifications worth poking at: independent company outcomes, no time-value modeling.
We are going to keep building things like this!